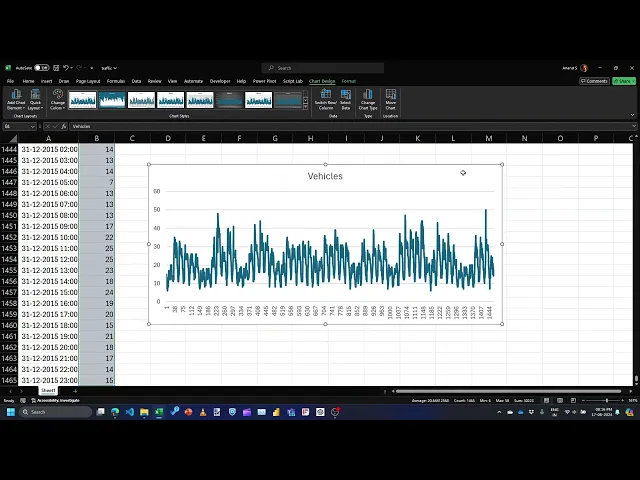
Tools in Data Science

    • Jan 2025: Tools in Data Science
    • Development Tools
      • Editor: VS Code
      • Python tools: uv
      • JavaScript tools: npx
      • Unicode
      • Browser: DevTools
      • CSS Selectors
      • JSON
      • Terminal: Bash
      • Spreadsheet: Excel, Google Sheets
      • Database: SQLite
      • Version Control: Git, GitHub
    • Deployment Tools
      • Markdown
      • Images: Compression
      • Static hosting: GitHub Pages
      • Notebooks: Google Colab
      • Serverless hosting: Vercel
      • CI/CD: GitHub Actions
      • Containers: Docker, Podman
      • Tunneling: ngrok
      • CORS
      • REST APIs
      • Web Framework: FastAPI
      • Local LLMs: Llamafile
    • Large Language Models
      • Prompt engineering
      • TDS TA Instructions
      • TDS GPT Reviewer
      • LLM Sentiment Analysis
      • LLM Text Extraction
      • Base 64 Encoding
      • Vision Models
      • Embeddings
      • Topic modeling
      • Vector databases
      • Retrieval Augmented Generation
      • Function Calling
    • Project 1
    • Data Sourcing
      • Scraping with Excel
      • Scraping with Google Sheets
      • BBC Weather API with Python
      • Scraping IMDb with JavaScript
      • Nominatim API with Python
      • Wikipedia Data with Python
      • Scraping PDFs with Tabula
      • Convert PDFs to Markdown
      • LLM Website Scraping
      • LLM Video Screen-Scraping
      • Scheduled Scraping with GitHub Actions
      • Scraping emarketer.com
      • Scraping: Live Sessions
    • Data Preparation
      • Data Cleansing in Excel
      • Data Transformation in Excel
      • Splitting Text in Excel
      • Data Aggregation in Excel
      • Data Preparation in the Shell
      • Data Preparation in the Editor
      • Cleaning Data with OpenRefine
      • Profiling Data with Python
      • Parsing JSON
      • Transforming Images
      • Extracting Audio and Transcripts
    • Data Analysis
      • Correlation with Excel
      • Regression with Excel
      • Forecasting with Excel
      • Outlier Detection with Excel
      • Data Analysis with Python
      • Data Analysis with SQL
      • Data Analysis with DuckDB
      • Geospatial Analysis with Excel
      • Geospatial Analysis with Python
      • Geospatial Analysis with QGIS
      • Network Analysis in Python
      • Visualizing Machine Learning
    • Project 2
    • Data Visualization
      • Visualizing Forecasts with Excel
      • Visualizing Animated Data with PowerPoint
      • Visualizing Animated Data with Flourish
      • Visualizing Network Data with Kumu
      • Visualizing Charts with Excel
      • Data Visualization with Seaborn
      • Google Charts
      • Google Data Studio
      • Actor Network Visualization
      • RAWgraphs
      • Data Storytelling
      • Interactive Notebooks: Marimo
      • Narratives with Excel
      • Narratives with Comics
    • Live Sessions
      • 15 Jan 2025
      • 16 Jan 2025
      • 17 Jan 2025
      • 20 Jan 2025
      • 21 Jan 2025
      • 22 Jan 2025
      • 23 Jan 2025
      • 28 Jan 2025
      • 29 Jan 2025
      • 30 Jan 2025
      • 31 Jan 2025
      • 01 Feb 2025
      • 04 Feb 2025
      • 06 Feb 2025
      • 07 Feb 2025

    Forecasting With Excel

    • Forecasting with Excel

    Forecasting with Excel#

    Forecasting with Excel

    Here are links used in the video:

    • FORECAST reference
    • FORECAST.ETS reference
    • Height-weight dataset from Kaggle
    • Traffic dataset from Kaggle
    Backward Regression With Excel Outlier Detection With Excel Forward
    • Forecasting with Excel