Geospatial Analysis with Excel#
You’ll learn how to create a data-driven story about coffee shop coverage in Manhattan, covering:
- Data Collection: Collect and scrape data for coffee shop locations and census population from various sources.
- Data Processing: Use Python libraries like geopandas for merging population data with geographic maps.
- Map Creation: Generate coverage maps using tools like QGIS and Excel to visualize coffee shop distribution and population impact.
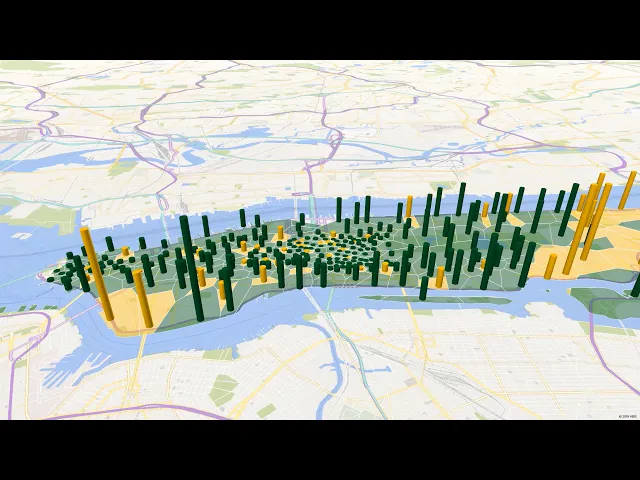
- Visualization: Create physical, Power BI, and video visualizations to present the data effectively.
- Storytelling: Craft a narrative around coffee shop competition, including strategic insights and potential market changes.
Here are links that explain how the video was made: