Correlation with Excel#
You’ll learn to calculate and interpret correlations using Excel, covering:
- Enabling the Data Analysis Tool Pack: Steps to enable the Excel data analysis tool pack.
- Correlation Analysis: Understanding statistical association between variables.
- Creating a Correlation Matrix: Steps to generate and interpret a correlation matrix.
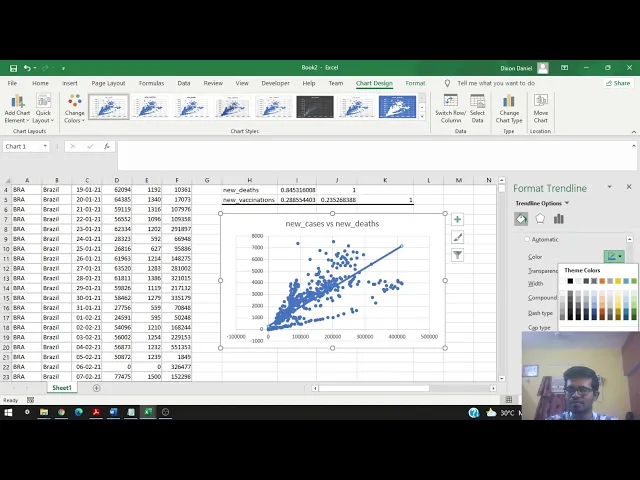
- Scatterplots and Trendlines: Plotting data and adding trend lines to visualize correlations.
- Analyzing Results: Comparing correlation coefficients and understanding their implications.
- Insights and Further Analysis: Interpreting scatterplots and planning further analysis for deeper insights.
Here are the links used in the video: