Data Analysis with Datasette#
Datasette is an open-source tool for exploring and publishing data. Created by Simon Willison, it turns any SQLite database into an instant web interface with powerful exploration features, JSON APIs, and visualization capabilities—all without writing code.
Unlike traditional database tools that require SQL knowledge upfront, Datasette provides an interactive interface for exploring data through faceting, filtering, and full-text search. It’s particularly powerful for data journalism, analysis workflows, and sharing datasets with non-technical audiences.
Installation#
Install Datasette using pip or uv:
pip install datasette
# or
uv tool install datasette
Start Datasette with any SQLite database:
datasette mydatabase.dbThis launches a web server at http://localhost:8001 with an instant interface to explore your data.
Create a Sample Dataset#
Let’s create a realistic e-commerce dataset to demonstrate Datasette’s analysis capabilities. This simulates common business patterns: customer orders with regional variations, seasonal trends, and product categories that enable realistic business questions like “Which regions generate the most revenue?” or “What are our seasonal sales patterns?”
sqlite3 ecommerce.db <<'SQL'
CREATE TABLE customers (
  customer_id INTEGER PRIMARY KEY,
  name TEXT,
  email TEXT,
  region TEXT,
  signup_date TEXT
);

CREATE TABLE products (
  product_id INTEGER PRIMARY KEY,
  name TEXT,
  category TEXT,
  price REAL,
  cost REAL
);

CREATE TABLE orders (
  order_id INTEGER PRIMARY KEY,
  customer_id INTEGER,
  product_id INTEGER,
  order_date TEXT,
  quantity INTEGER,
  status TEXT,
  FOREIGN KEY(customer_id) REFERENCES customers(customer_id),
  FOREIGN KEY(product_id) REFERENCES products(product_id)
);

-- Insert sample customers
INSERT INTO customers (customer_id, name, email, region, signup_date)
SELECT
  seq,
  'Customer ' || seq,
  'customer' || seq || '@example.com',
  CASE (seq % 4)
    WHEN 0 THEN 'North'
    WHEN 1 THEN 'South'
    WHEN 2 THEN 'East'
    ELSE 'West'
  END,
  date('2024-01-01', '+' || (seq % 365) || ' days')
FROM (
  WITH RECURSIVE cnt(x) AS (SELECT 1 UNION ALL SELECT x+1 FROM cnt LIMIT 100)
  SELECT x AS seq FROM cnt
);

-- Insert sample products
INSERT INTO products (product_id, name, category, price, cost)
VALUES
  (1, 'Laptop', 'Electronics', 999.99, 600.00),
  (2, 'Mouse', 'Electronics', 29.99, 15.00),
  (3, 'Desk Chair', 'Furniture', 299.99, 150.00),
  (4, 'Monitor', 'Electronics', 399.99, 200.00),
  (5, 'Desk Lamp', 'Furniture', 49.99, 20.00),
  (6, 'Keyboard', 'Electronics', 79.99, 40.00),
  (7, 'Bookshelf', 'Furniture', 199.99, 100.00),
  (8, 'Webcam', 'Electronics', 89.99, 45.00);

-- Insert sample orders
INSERT INTO orders (order_id, customer_id, product_id, order_date, quantity, status)
SELECT
  seq,
  (seq % 100) + 1,
  (seq % 8) + 1,
  date('2024-01-01', '+' || (seq % 365) || ' days'),
  CASE WHEN random() % 10 < 8 THEN 1 ELSE (random() % 3) + 1 END,
  CASE (random() % 10)
    WHEN 0 THEN 'pending'
    WHEN 1 THEN 'cancelled'
    ELSE 'completed'
  END
FROM (
  WITH RECURSIVE cnt(x) AS (SELECT 1 UNION ALL SELECT x+1 FROM cnt LIMIT 500)
  SELECT x AS seq FROM cnt
);

-- Create indexes for performance
CREATE INDEX idx_orders_customer ON orders(customer_id);
CREATE INDEX idx_orders_product ON orders(product_id);
CREATE INDEX idx_orders_date ON orders(order_date);
SQL
Now launch Datasette to explore this data:
datasette ecommerce.dbVisit http://localhost:8001 to see your database interface.
Understanding the Database Interface#
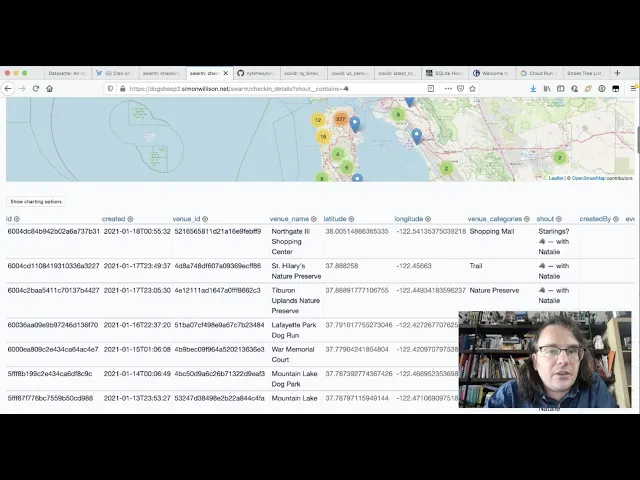
When you first open Datasette, you’ll see the database homepage with all available tables, row counts, and a SQL query box. Click any table name (like orders) to start exploring.
The table view shows your data with powerful interactive features:
- Sort columns by clicking headers
- Column menus (cog icon) for faceting and filtering
- Pagination controls for large datasets
Using Facets for Discovery#
Facets show the distribution of values in a column—Datasette’s killer feature for exploratory analysis.
Click the cog icon next to status and select “Facet by this”. You’ll see counts like:
completed: 400pending: 50cancelled: 50
Each count is clickable to filter the data. This instantly answers “How many orders are in each status?”
Multiple facets reveal deeper patterns. Facet by status, then add region and product category to see which regions cancel most often or which categories sell best where.
Filtering Data#
Filters drill into specific subsets. Datasette supports:
Exact match:
?status__exact=completedText contains:
?name__contains=LaptopNumeric comparisons:
?quantity__gt=1Date ranges:
?order_date__gte=2024-06-01&order_date__lt=2024-07-01Stack filters to answer questions like “Show completed Electronics orders from the North region with quantity > 1”.
Running SQL Queries#
For complex analysis, use the SQL editor. Click “SQL” in the navigation or the query box on the database homepage.
Revenue by region:
SELECT
  c.region,
  COUNT(DISTINCT o.order_id) as orders,
  SUM(o.quantity * p.price) as revenue,
  ROUND(AVG(o.quantity * p.price), 2) as avg_order
FROM orders o
JOIN customers c ON o.customer_id = c.customer_id
JOIN products p ON o.product_id = p.product_id
WHERE o.status = 'completed'
GROUP BY c.region
ORDER BY revenue DESC
Top customers:
SELECT
  c.name,
  c.region,
  COUNT(o.order_id) as orders,
  SUM(o.quantity * p.price) as lifetime_value
FROM customers c
JOIN orders o ON c.customer_id = o.customer_id
JOIN products p ON o.product_id = p.product_id
WHERE o.status = 'completed'
GROUP BY c.customer_id
ORDER BY lifetime_value DESC
LIMIT 10
Query results can be faceted, filtered, and exported just like tables.
Exporting Data#
Every view exports to CSV, JSON, or newline-delimited JSON. Click .csv or .json links at the bottom of any page.
Exports respect your current filters:
# Export only completed North region orders
curl "http://localhost:8001/ecommerce/orders.csv?status__exact=completed"
API access is built-in. Add .json to any URL:
curl "http://localhost:8001/ecommerce/orders.json?_shape=array"Creating Canned Queries#
Save frequently-run analyses as named queries that appear in the sidebar.
Create metadata.json:
{
  "databases": {
    "ecommerce": {
      "queries": {
        "top_customers": {
          "sql": "SELECT c.name, SUM(o.quantity * p.price) as total FROM customers c JOIN orders o ON c.customer_id = o.customer_id JOIN products p ON o.product_id = p.product_id WHERE o.status = 'completed' GROUP BY c.customer_id ORDER BY total DESC LIMIT 10",
          "title": "Top 10 Customers"
        }
      }
    }
  }
}
Launch with metadata:
datasette ecommerce.db -m metadata.jsonNow “Top 10 Customers” appears in the sidebar, creating a self-service analytics portal.
Publishing Data#
Share your analysis by deploying to the web:
datasette install datasette-publish-vercel
datasette publish vercel ecommerce.db --project=my-analysis
Your database is now public with full faceting, filtering, and API access.
Useful links:
- Datasette Documentation
- Datasette Plugins
- Datasette Examples
- Learn SQL with Datasette
- Simon Willison’s blog
- sqlite-utils Documentation
Datasette transforms SQLite databases into instant exploration tools. By combining faceting, filtering, and SQL queries in an intuitive interface, it makes data analysis accessible to both technical and non-technical users—perfect for quick exploration, self-service BI, and publishing datasets for transparency.