Data Analysis with Python#
You’ll learn practical data analysis techniques in Python using Pandas, covering:
- Reading Parquet Files: Utilize Pandas to read Parquet file formats for efficient data handling.
- Dataframe Inspection: Methods to preview and understand the structure of a dataset.
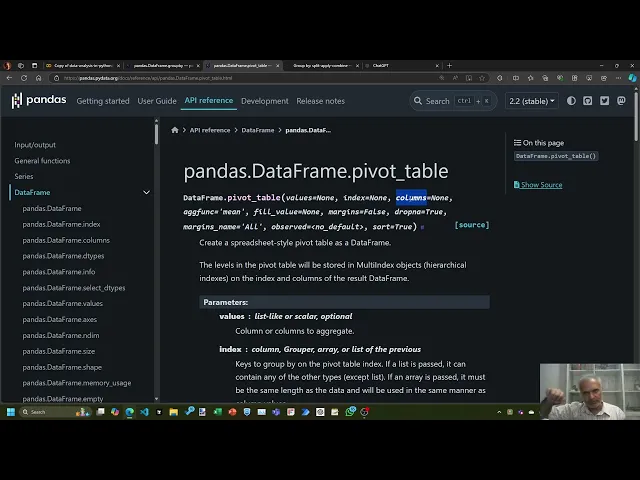
- Pivot Tables: Creating and interpreting pivot tables to summarize data.
- Percentage Calculations: Normalize pivot table values to percentages for better insights.
- Correlation Analysis: Calculate and interpret correlation between variables, including significance testing.
- Statistical Significance: Use statistical tests to determine the significance of observed correlations.
- Datetime Handling: Extract and manipulate date and time information from datetime columns.
- Data Visualization: Generate and customize heat maps to visualize data patterns effectively.
- Leveraging AI: Use ChatGPT to generate and refine analytical code, enhancing productivity and accuracy.
Here are the links used in the video: