Data visualization#
Effective visuals connect analysis to decisions. This module spotlights the tools that help you design narratives, build interactive experiences, and adapt outputs for every kind of audience.
You’ll practice:
- Story-first planning with data storytelling frameworks and LLM partners such as ChatGPT to refine messaging.
- Portable presentations spanning HTML decks in RevealJS, Markdown slides in Marp, and notebook-native sessions in Marimo.
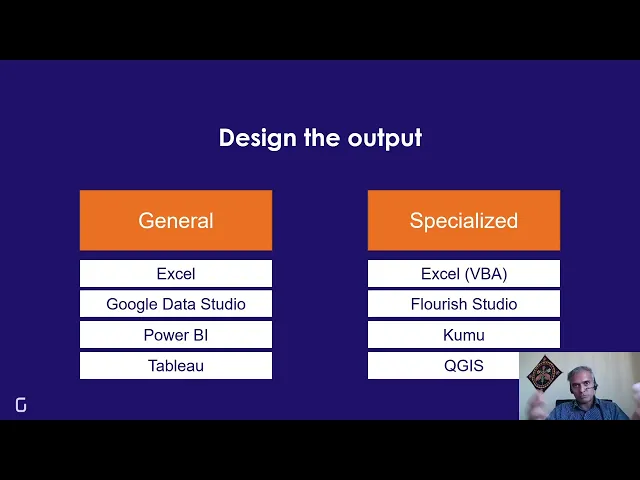
- Specialized builders including RAWgraphs, Seaborn, Excel forecasting charts, Flourish animations, PowerPoint motion, and Kumu network diagrams.
- Collaborative perspectives through actor network visualizations and AI-assisted storytelling that keep stakeholders aligned.
Use these resources to turn complex analyses into clear, compelling stories wherever your viewers meet them.