Vibe Analysis#
Vibe analysis is analyzing data as if the analysis itself doesn’t exist—you focus only on business outcomes, skipping intermediate steps.
This approach emerged from vibe coding, where you code as if code doesn’t exist. With vibe analysis, you give an LLM full context, state your goal, and review only the answers. The LLM handles exploration, cleaning, modeling, visualization, and deployment.
Watch these comprehensive talks on vibe analysis and the changing role of data scientists:
In this module, you’ll learn:
- Core vibe analysis workflow: From data to deployed insights without manual coding
- Automated exploration: Using LLMs to generate and test hypotheses
- Data quality automation: Detecting non-obvious issues and creating validation rules
- Visual storytelling: Building publication-ready data stories with style transfer
- Meta-prompting techniques: Improving prompts before execution
The traditional data science workflow#
A data scientist typically:
- Explores the data (EDA, profiling, types, missing values)
- Cleans it (deduping, anomalies, schemas)
- Models it (features, algorithms, parameters)
- Explains it (narratives, visualizations, slides)
- Deploys it (APIs, dashboards, reports)
- Anonymizes it (synthetic data for case studies)
Each step can take days or weeks. Vibe analysis automates most of this cycle.
What’s dying vs what’s rising#
Tasks being automated#
- EDA: Profiling, types, missing values, deduping, anomaly detection
- Scaffolds: Loaders, schemas, docstrings, README files, tests
- AutoML: Feature selection, model choice, parameter tuning, metrics
- Code writing: LLMs can fill in 80% from specifications
- Explainers: Generating narratives, visuals, presentations
- Forms: Project reports, timesheets, documentation
Skills becoming critical#
- Leadership: Setting the right goal and allocation across human and AI teams
- Problem framing: Precise prompts that reduce iteration cycles
- Eval design: Automated validation with binary checks and LLM-as-judge
- Invariants: Defining ontologies, declaring truths and constraints
- Verticalization: Domain-specific datasets and workflows as competitive moats
- Trust & taste: Auditing AI output, telling compelling stories
Key insight: LLMs aren’t better than the best humans, but they’re better than average or worst performers in many areas. They can’t multiply 8-digit numbers, but they excel at language—and code is language.
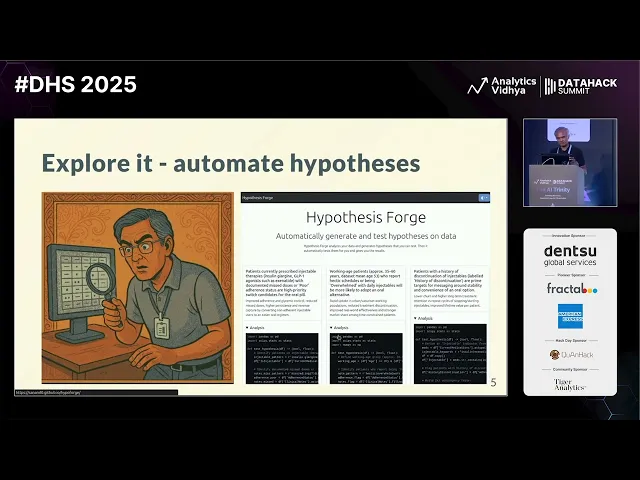
Automated hypothesis generation#
Instead of manually exploring data, use LLMs to generate business hypotheses automatically.
Try HypoForge, a tool that:
- Uploads your dataset
- Generates business hypotheses based on column headers and sample data
- Writes code to test each hypothesis
- Runs statistical tests (correlation, significance)
- Reports which hypotheses the data supports
Example prompt:
Dataset: India aviation traffic data
Context: Naya Airlines wants to launch in India. How can they make money?
Think like a greedy businessman.

Generate hypotheses and test them.
Sample hypotheses generated:
- “Launch predominantly domestic point-to-point network targeting busiest metros”
- “Higher load factors during festival months (May)”
- “Focus on high per-capita routes”
The tool tests each hypothesis statistically and reports results—green for supported, red for rejected.
Rigor is for wimps. Let the LLM test everything in parallel. When done, have it craft an executive summary you can directly present.
Vibe analysis workflow#
The complete workflow for vibe analysis:
1. Provide context#
Upload your dataset to ChatGPT, Claude, or Codex.
Give it business context:
I have aviation traffic data. Naya Airlines wants to launch in India.
Their operations head needs to know:
- Which cities will make the most money
- Which routes will always be full
- What prices people will happily pay
2. Request comprehensive analysis#
Ask for specific analyses OR ask it to discover insights:
Perform analysis and generate insights. Include:

- Route leaderboard, growth, seasonality
- Network exploration with weighted edges and centrality
- Per-capita comparisons for fairness
- Carrier variation, entry/exit patterns

Summarize insights as poetry for entertainment.
The LLM will:
- Write Pandas/NumPy code
- Run statistical tests
- Generate visualizations
- Create summaries
Example output poetry:
“Routes of gold, a leaderboard sings. Delhi to Mumbai, the crown that it brings. Hyderabad rises with traffic so bright. Growth curves soaring, a new city’s flight.”
3. Let it work autonomously#
Use Agent Full Access mode (in Codex or similar tools) to eliminate approval prompts. The agent runs autonomously, writing and executing code.
Best practice: Run multiple agents in parallel—one for analysis, one for planning, one for visualization. This avoids waiting and context pollution.
4. Find non-obvious insights#
Have the LLM focus on surprising patterns:
Find the most interesting, useful, and non-obvious insights
from this data. Explain in simple, witty language for a senior exec.
The LLM might discover:
- Hyderabad → Hyderabad is an active route (data error!)
- Cumulative drone certificates decrease some days (withdrawn certificates)
- June 7, 2023: 86K international arrivals exceeds global traffic (anomaly!)
- Dec 4, 2023: 894K footfalls vs 804K people—90K teleported? (data quality issue)
Automated data quality checks#
Traditional data cleaning is painful. Automate it.
Try SchemaForge, which:
- Uploads datasets (CSV, Excel, databases)
- Identifies column types, descriptions, PII, keys
- Detects data quality issues
- Generates DBT validation rules
- Creates a downloadable package to run checks
Alternatively, use ChatGPT directly:
Perform COMPREHENSIVE and ADVANCED data quality analysis.

For each dataset, list every clear and potential data quality issue.
Make sure these are non-obvious, non-trivial, and mind-blowing!

Suggest approaches to automatically fix these.
Example issues found:
- Active route from Hyderabad to Hyderabad
- Cumulative counts that decrease
- Traffic exceeding global totals
- Footfalls exceeding passenger counts
Visual data stories#
Create beautiful, interactive visualizations styled after leading publications.
Style transfer technique#
Instead of specifying every detail, reference a style:
Create a beautiful visual data story as a single-page web app
that explains these insights in the style of The New York Times.
The LLM understands:
- New York Times = scrollytelling, clean typography, data-driven narratives
- South China Morning Post = interactive graphics, bold colors
- The Economist = minimal, chart-focused
Key insight: Having a mental catalog of styles (developers, painters, publications) makes prompting far more efficient than explicit instructions.
Generate and publish#
Complete workflow:
Create a beautiful visual data story as a single-page web app
that explains this insight in the style of The New York Times.
The agent generates:
index.htmlwith the storystyle.csswith stylingscript.jswith interactions
Preview locally:
python -m http.server
# Open http://localhost:8000
Publish to GitHub Pages:
- Create a new GitHub repo
- Upload the three files
- Go to Settings → Pages
- Select “main” branch → Save
- Visit
https://username.github.io/repo-name/
You’ve now vibe analyzed, vibe coded, and vibe deployed.
Creating synthetic data with hypotheses#
Don’t generate random fake data—it yields no insights. Instead, align synthetic data with business hypotheses.
Prompt:
Generate realistic fake data for [domain]

1. List columns and their distributions
2. List 5 hypotheses about the data
3. Generate 2,000 random rows that align with
   hypotheses in a statistically significant way
4. Test each hypothesis to verify alignment
5. Let me download as CSV
Example for airline data:
Hypotheses generated:
- Monsoon months have higher delays
- Longer flights have higher base fares
- Holiday periods show higher load factors
The LLM creates data where these patterns hold, making it useful for demos and case studies without exposing real data.
Read more: How to fake data that tells a story
Meta-prompting: improve prompts before execution#
Use LLMs to optimize your prompts before running analysis. This reduces confusion and increases single-shot success rates.
Workflow:
- Write your initial prompt
- Add: “Suggest an improved prompt for this”
- Review the improved version
- Run the improved prompt in a fresh session
Example transformation:
Original prompt:
Analyze this weekday vs weekend sales dataImproved prompt (generated by LLM):
You are a retail analytics expert working with Middle East sales data.

Analyze weekday versus weekend sales patterns, considering:
- Regional variations (Friday weekends in UAE vs Saturday-Sunday in other regions)
- Seasonal effects and holidays
- Per-store and per-category breakdowns
- Statistical significance of observed differences

Provide actionable recommendations with clear tradeoffs.
Generate visualizations showing top/bottom performers and significant gaps.
The improved prompt is clearer, includes domain context, and specifies outputs. This dramatically increases the quality of results.
Parallel chat strategy#
Don’t wait for agents to finish. Run multiple chats in parallel:
- Chat 1: Main analysis and coding
- Chat 2: “What interesting, useful analysis can I run on this dataset?”
- Chat 3: “Find the most interesting, useful, non-obvious insights”
While Chat 1 executes, Chats 2 and 3 provide planning and suggestions. When Chat 1 finishes, you have multiple perspectives and can choose the best path.
Key principle: If you ask an LLM to plan and execute, it allocates less thinking to planning. Separate planning from execution for deeper thinking.
Model selection and reasoning#
For visual aesthetics and complex analysis:
- GPT-5 (via Codex): Set
reasoning_efforttohighfor better structure - Claude 3.5 Sonnet: Best aesthetics, strong at visual design
- Gemini 2.5 Pro: Good balance, web-based via Jules
Configure in Codex config.toml:
[models.gpt5]
reasoning_effort = "high"
Higher reasoning effort means more thoughtful outputs, especially for aesthetics and architecture.
Error detection and validation#
Don’t trust LLM output blindly. Use multiple validation strategies.
1. Multi-model review#
Ask different models to find errors:
Find errors in the analysis that generated this data visualization.
Focus on numerical and statistical errors.
Example errors caught:
- Division by zero when denominator is empty
- Frame latency of 44 minutes (impossible—likely timestamp vs frame rate confusion)
- Using peak/average without distribution analysis (omission error)
Key insight: Many eyes make bugs shallow. Run multiple LLM “reviewers” as a sieve—each catches different flaws.
2. Checksum validation#
When generating summaries, ask the LLM to:
Break down into categories with totals.
Verify as you go along.
Create a checksum list.
This forces the LLM to validate its own work during generation.
3. Post-validation prompts#
After analysis, ask:
Review this analysis for:
- Numerical errors
- Statistical errors
- Missing considerations
- Impossible values
- Data quality issues
Making analysis repeatable#
Once you have good results, convert the analysis into repeatable code.
Create an analysis.py file that will recreate this analysis
and generate an XLSX file with required data.
Why create a script?
- Consistency: Re-run the same analysis weekly with new data
- Verification: Multiple LLMs can review the code for errors
- Transparency: Stakeholders see exactly what was calculated
- Testing: Add unit tests to catch regressions
The script is a byproduct, not the primary product. You analyze first, then extract code.
Context management and session hygiene#
Reset over repair#
Long conversations accumulate bad assumptions (“context rot”). When errors compound:
- Start a fresh chat with a clean prompt
- Save working code before attempting modifications
- Keep changes small and independently verifiable
If a fix doesn’t land in one pass, reset rather than iterate through broken context.
Summarize and restart#
After a long session with multiple corrections:
Given this conversation, give me one prompt that will do
the equivalent of all we have done so far.
Use this condensed prompt to start fresh, avoiding accumulated errors.
Meta-analysis: analyzing your analysis#
LLMs log all actions. Review logs to improve your workflow.
Tools:
- Codex logs: Stored in
~/.codex/sessions/YYYY-MM-DD/ - Log parser: Convert JSONL logs to readable markdown
Example: tools-in-data-science/codex-log-parser (fictional link—build your own)
Review patterns:
- What questions do you ask most?
- What does the LLM do well?
- Where does it stall or fail?
- Could different libraries help?
- Should you delegate certain tasks differently?
Meta-analysis is analyzing your analysis process to continuously improve prompts, tools, and workflows.
Risk mitigation strategies#
Three layers of protection when shipping LLM insights to executives:
1. Frame safe questions#
Ask questions that can’t go wrong:
- General business recommendations: LLMs excel at business strategy language
- Options with tradeoffs: “Here are 3 approaches with pros/cons”
- Directional insights: “Traffic is increasing in these regions” vs precise numbers
2. Reduce error likelihood#
Structure prompts to minimize mistakes:
- Write code first, then analyze (code is reviewable)
- Add citations: “Include row numbers for each insight”
- Request checksums: “Provide category totals that sum to overall total”
- Verify as you go: “After each step, validate assumptions”
3. Post-validation#
Before presenting:
- Ask the LLM: “Find errors in this analysis”
- Use multiple models for cross-validation
- Run automated statistical checks
- Human review of anomalies
Daily practice recommendations#
90% of these techniques will be outdated within a year. The only way to stay current: practice.
Do at least two vibe analyses a day on personal data:
- Phone usage data
- Bank statements
- Email patterns
- Calendar analysis
- Git commits
- Browser history
- Spotify/YouTube history
- Google search history
- Fitness data (Fitbit, Google Fit)
- Jira ticket patterns
Personal data is everywhere. You’ll learn about yourself and master vibe analysis techniques.
Complete example: aviation analysis#
Full workflow from data to deployed dashboard:
Context: Naya Airlines launching in India. Operations head wants
to know which cities will make money, which routes stay full,
and what prices work.

1. Route leaderboard and growth analysis
2. Network analysis with centrality metrics
3. Per-capita fairness assessment
4. Carrier variation and market entry/exit
5. Seasonal patterns and demand forecasting

For weekday vs weekend analysis:
- Consider regional variations (Friday vs Saturday-Sunday weekends)
- Account for holidays and festivals
- Break down by store, category, territory
- Statistical significance testing

Generate:
- Executive summary with top 3 recommendations
- Interactive visualizations in NYT style
- Downloadable data and analysis.py script
The LLM handles everything: data loading, cleaning, analysis, visualization, code generation, and deployment scaffolding.
Tools and platforms#
Primary platforms for vibe analysis:
- ChatGPT: Code execution, large file uploads (up to ~500MB)
- Codex: Voice dictation, repository integration, GitHub publishing
- Jules: Web-based Cursor alternative (free tier available)
- Claude: Strong aesthetics, Code mode for analysis
- Cursor: Desktop IDE with AI coding
Best practices summary#
- Provide full context upfront—don’t make the LLM guess
- Separate planning from execution for deeper thinking
- Run parallel sessions to avoid waiting
- Use style transfer (“in the style of X”) over detailed specs
- Create repeatable scripts after successful analysis
- Validate with multiple models as error-catching sieves
- Start fresh sessions when context rots
- Practice daily on personal data
- Frame questions safely when accuracy is uncertain
- Extract and commit prompts as your source code
The new data scientist role#
Your role has changed:
- Don’t manually explore, clean, model, or visualize anymore
- Do frame problems clearly, design evaluations, define invariants, audit outputs, and tell compelling stories
- Think like a team lead managing both human and AI intelligence
- Focus on domain expertise and taste, not code
The tasks of 2023-2024 data scientists are automated. The talent isn’t obsolete—it’s redirected toward higher judgment, creativity, and strategy.
Rest in peace, old-world data scientists. Welcome, new data scientists.
Further resources#
- Talks and slides
- RIP Data Scientists - Full transcript
- Vibe Analysis workshop materials
- Prompt to Plot - Non-coders building visualizations
- How to fake data that tells a story
- India aviation traffic dataset
Vibe analysis represents a fundamental shift: from manual data science workflows to outcome-focused collaboration with AI. The most successful analysts treat LLMs as force multipliers that amplify domain expertise rather than replacements for judgment.