TA session : PYQ Dec 23 discussion#
Duration: 1h 12m
This is an FAQ summary of a live tutorial.
Q1: What is this session about?
A1: This session is about discussing previous year question papers. Specifically, we’ll be reviewing the December 2023 question paper.
Q2: What was different about the December 2023 exam paper compared to previous ones?
A2: Historically, exams had 60 questions and were 1.5 hours long. The December 2023 paper was different, with only 21 questions. These questions were also very conceptual and a bit tough.
Q3: How can I find all possible values of categories inside a Pandas DataFrame column named ‘Book’, assuming the DataFrame is named ‘data_df’?
A3: You can use two methods to access the column and then the .unique() function to get all possible values.
Method 1: data_df.Book.unique()
Method 2: data_df['Book'].unique()
Both methods achieve the same result. Remember, the general structure is: DataFrameName.ColumnName.Function() or DataFrameName['ColumnName'].Function().
Q4: Which Python library is specifically used for geospatial analysis?
A4: The correct Python library for geospatial analysis is geopandas.
Q5: Is QGIS a Python library?
A5: No, QGIS is not a Python library. It’s a separate software application used for geospatial analysis.
Q6: What about Folium? Is that a Python library for geospatial analysis?
A6: Yes, Folium is a Python library, but we didn’t cover it in our sessions. GeoPandas is the one we discussed and is correct for this context.
Q7: Is OpenStreetMap a Python library?
A7: No, OpenStreetMap is not a Python library. It’s a different software that provides a collection of maps.
Q8: If using cross-validation, the ideal ‘k’ in K-Nearest Neighbors (KNN) is found to be 6. What does this mean for a model using k=2, and how can we find the ideal ‘k’?
A8: If the ideal k is 6, but the model uses k=2, it means k is too low. A low k value typically leads to overfitting (the model learns the training data too well, including noise) and high variance.
You can find the ideal k using the Elbow Method, which involves plotting loss versus k and looking for the “elbow” point where the loss starts to level off. We covered this in detail in the last class.
Q9: How can we observe the analysis metric “slope”?
A9: When you’re looking for the “slope” of a metric, you’re usually thinking about regression and trend lines. So, you can observe slope through trend lines and regression analysis (like linear regression) which also involves concepts like correlation. The basic y = mx + c line equation is also relevant here.
Q10: In which tabs of the Inspect Element tool (developer tools in browsers) can you find cookie information?
A10: You can find cookie information in two main tabs within the Inspect Element tool:
- Network tab
- Application tab
If you’re unsure about the Application tab, the Network tab is definitely where you can find it.
Q11: In network analysis, what are the necessary column names for the DataFrame that is passed by default for making connections?
A11: The necessary column names are ‘from’ and ’to’. It’s important to note that it’s ‘from’ and ’to’, not ’to’ and ‘from’. This order matters because sometimes maps or networks are directional, indicating a start and end point.
Q12: If the p-value in regression analysis is less than the significance level (e.g., 0.05), what does it generally indicate?
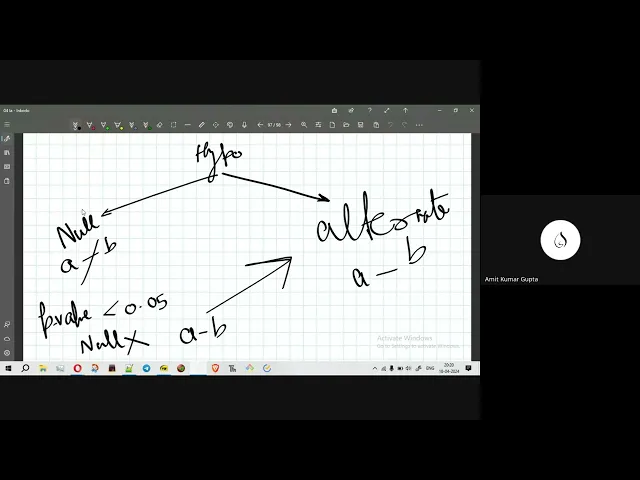
A12: If the p-value is less than the significance level, it generally indicates that the relationship between the variables is statistically significant. This means we reject the null hypothesis (which typically assumes no relationship between variables), implying that there is a relationship between them.
Q13: What is OpenRefine used for?
A13: OpenRefine is primarily used for data cleaning and transformation. It helps fix inconsistencies and errors in data, such as spelling mistakes or variations in how similar data entries are recorded (e.g., “UP” vs “U.P.” for Uttar Pradesh). It uses algorithms to identify and cluster similar-looking data, allowing you to merge them into a single, standardized entity.
There’s a function called .facet() in OpenRefine that helps combine similar but different strings. You can also replace entries with the most frequent or chosen name.
Q14: How can you change the starting day of the week to Sunday in the WEEKNUM function in Excel?
A14: The WEEKNUM function in Excel takes two arguments: (date, return_type). The return_type argument specifies which day of the week is considered the start.
1or omitted: Week starts on Sunday (default).2: Week starts on Monday.- Other numbers (e.g., 11, 12, 13, 14, 15, 16, 17) correspond to different starting days (e.g., 11 for Monday, 12 for Tuesday, etc.).
So, to change the starting day to Sunday, you would use WEEKNUM(date, 1) or WEEKNUM(date).
Q15: What is a Workbook in Tableau terminology?
A15: In Tableau, a Workbook is similar to a project or folder that contains various sheets. These sheets can be either Worksheets, Dashboards, or Stories.
Q16: Is the K-Means clustering algorithm sensitive to the initial choice of centroids?
A16: Yes, the K-Means clustering algorithm is sensitive to the initial choice of centroids. Different starting centroids can lead to different final cluster assignments and results. For example, if you choose centroids that are very close together initially, the algorithm might converge to a suboptimal solution.
Q17: Which parameter in the K-Means function helps the user mitigate the problem of centroid sensitivity?
A17: The n_init parameter in the K-Means function (specifically in scikit-learn’s KMeans class) helps mitigate this problem. n_init determines the number of times the K-Means algorithm will be run with different centroid seeds. The best result among these runs (in terms of inertia) is then chosen. By default, n_init is set to ‘auto’ in scikit-learn.
There are also methods for centroid initialization like k-means++ (which is the default in scikit-learn for init parameter) and random. k-means++ intelligently selects initial centroids that are spread out, reducing the likelihood of poor clusterings.
Q18: What command is used in Streamlit to add text to the app interface?
A18: The command used to add text to the Streamlit app interface is .text().
For example, if you import Streamlit as st, you would use st.text("Your text here"). The alias st is a convention, but you can define it yourself when importing the library.
Q19: Which tab in Chrome Dev Tools will show API calls on a website?
A19: The Network tab in Chrome Dev Tools will show API calls (network requests and responses) made by a website. Chrome Dev Tools is another name for the browser’s Inspect Element tool.
Q20: How can Chrome Dev Tools be accessed?
A20: Chrome Dev Tools can be accessed by right-clicking on a webpage and choosing “Inspect” (or “Inspect Element”).
Q21: Does Nominatim output the type of place for every latitude and longitude?
A21: Yes, Nominatim can output the type of place. If you provide latitude and longitude coordinates, it can give you details about the location, including its name, address, and geographical features (e.g., whether it’s a city, a river, a mountain). Conversely, if you give it a place name, it will return the latitude and longitude.
Q22: How can you change the calculation performed in the values area of a pivot table (e.g., from sum to average)?
A22: To change the calculation (e.g., from sum to average) in the values area of a pivot table:
- Right-click on the cell in the values area of the pivot table.
- Select “Value Field Settings”.
- In the dialog box, you can choose the desired calculation (e.g., Sum, Count, Average, Max, Min).
Q23: What happens if you choose the “Delimited” option in Text to Columns in Excel but don’t select any delimiter?
A23: If you choose the “Delimited” option in Excel’s Text to Columns wizard but do not select any specific delimiter (like comma, tab, space, etc.), Excel will not split the text. The original content will remain unchanged in a single column. It won’t default to comma or any other delimiter unless explicitly selected.