TA session : PYQ April 23 discussion part - 1#
Duration: 1h 44m
Here’s an FAQ summary of the live tutorial, focusing on student questions and concise answers:
Q1: What’s the main difference in the question paper format we’re discussing today (April 2023) compared to yesterday’s (December 2023)?
A1: Yesterday’s paper had only 21 highly conceptual questions. Today’s paper has 62 questions, which are mostly theoretical. If you know the answer, you know it.
Q2: We have data about country demographics, geographic information, and GDP, and we want to visualize it and generate a summary. Which is the most suitable approach given these options?
A2: The best approach here is to use Power BI for visualization and to generate the data summary.
- Power BI can be used for visualization.
- Power BI can generate data summaries.
- Quill is an extension of Tableau, not Power BI, so using Quill with Power BI for summary is incorrect.
Q3: My project requires studying districts and their health indicators. I have a shape file. Which tool should I use?
A3: Since you’re dealing with geographic data and a shape file, QGIS is the most suitable tool. QGIS can create shape files and also allows you to identify districts with high health indicators by assigning colors or creating bar charts based on the data within the shape file.
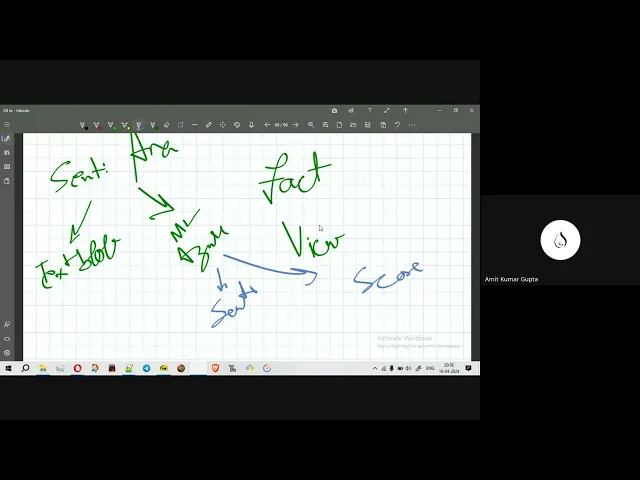
Q4: What are the two main outputs provided by Excel Azure Machine Learning for sentiment analysis?
A4: The two main outputs of Excel Azure Machine Learning are Sentiment (which indicates if the text is positive, negative, or neutral) and a Score (a numerical value typically between 0 and 1). (For context, if you were using Python’s TextBlob library, the outputs would be Subjectivity and Polarity.)
Q5: I have a dataset with annual cotton production, rainfall, loan interest, and fuel price. I want to compute the correlation between annual cotton production and other variables. What’s the most suitable option?
A5: You can use Excel’s Data Analysis Toolpak, specifically the correlation measure, to compute correlations between variables. Excel’s CORREL function is also suitable for this purpose.
Q6: I’m preparing my dataset and using Pandas Profiling for exploratory analysis. Which of these is a correct statement about its capabilities?
A6: Pandas Profiling provides a surface-level analysis of your data, offering various statistical reports like mean, mode, median, variance, and standard deviation. It also provides information about outliers through quartiles (Q1, Q2, Q3).
Q7: ComicGen is a tool for data storytelling. Which of the following is NOT a function of ComicGen?
A7: The statement “You can type your data story and get your comic” is NOT a function of ComicGen. ComicGen is not a generative AI; it allows you to select pre-existing comic characters, customize their emotions and poses, and then import or embed them. You select elements, you don’t type a story and have it generate a unique comic from scratch.
Q8: I have a very large matrix with many zero entries. Which function from the SciPy library is useful for efficient storage of such a matrix?
A8: A matrix with many zero entries is called a sparse matrix. For efficient storage in SciPy, you should use the CSR matrix (Compressed Sparse Row).
Q9: Which functions and tools are useful for analyzing large graph and network data?
A9: For analyzing large graph and network data, the tools typically used are Kumu and SciKit Network. Kumu is especially useful for visualizing complex networks.
Q10: Which library has functions to extensively extract data from Wikipedia pages?
A10: The Wikipedia library in Python is specifically designed for extracting data from Wikipedia pages. While Beautiful Soup is a general web scraping library, the Wikipedia library offers a ready-made solution for Wikipedia content.
Q11: I have data about country and population, and I want to visualize it in Tableau, but the map representation isn’t activating. What might be the potential problem?
A11: Tableau can visualize maps using just country names if the data is clean. A potential problem could be column type incompatibility issues. For example, if the country names are stored in a format Tableau doesn’t recognize as a geographic entity, it might not activate the map feature.
Q12: What tool is helpful to understand the structure of a website or inspect it before writing a web scraping script?
A12: The Inspect Element feature (often called “Developer Tools”) in web browsers is used to understand a website’s structure and inspect its HTML content before writing a scraping script.
Q13: Which library has tools to get a web page’s HTML content into Python?
A13: The Requests library (or urllib) is used to get the raw HTML content of a web page into Python. Beautiful Soup is then used to parse and beautify that HTML content once it’s already in Python.
Q14: Nominatim API can be used to find the type of place.
A14: True. Nominatim can retrieve detailed information about a location, including its type (e.g., building, library, university).
Q15: Which among the following Excel chart is the most suitable for detecting outliers in data?
A15: The Box and Whisker chart (or Violin plot) is most suitable for detecting outliers in data. Candlestick charts, while showing data ranges, are primarily used in financial analysis and are not ideal for outlier detection based on quartiles.
Q16: Which Excel feature allows you to scrape data from a website?
A16: Excel has a “Get Data from Website” feature, often found under the Data > Get Data > From Web options, which allows you to import data from web pages. You can also use “Query” features for more advanced data retrieval.
Q17: You have a data column ‘sales_date’ and you want to extract the week number. Which function should you use in Excel?
A17: You should use the WEEKNUM function in Excel (e.g., WEEKNUM(cell, [return_type])).
Q18: Data with calorie intake, weight, and BMI is given. You want to compute the correlation coefficient between these three variables. Do you need to specify input and target variables?
A18: No. For computing correlation coefficients, you do not need to explicitly specify input and target variables. Correlation is a pairwise measure, and Excel’s correlation tool can generate a correlation matrix showing the relationships between all specified variables without requiring a designated input or target. This is different from linear regression, where you do need to define dependent (target) and independent (input) variables.
Q19: What is the purpose of using the ‘find’ method in Beautiful Soup?
A19: The ‘find’ method (along with ‘find_all’) in Beautiful Soup is used to find specific HTML tags or attributes within the parsed HTML content.
Q20: K-Means is a clustering algorithm. Which of the following statements about it is true?
A20: K-Means clustering is sensitive to the initial choice of centroids. This means the starting points chosen for the clusters can influence the final clustering result. Functions like N_init (or K-Means++) are used to mitigate this sensitivity.
Q21: You are working with a Pandas DataFrame that has a ‘salary_range’ column with categories like ‘medium’, ‘high’, ‘very high’. You want to find the number of employees in each category. Which command can help you?
A21: You can use the value_counts() function on the ‘salary_range’ column (e.g., df['salary_range'].value_counts()) to get a count of occurrences for each unique value in that column.
Q22: You are using the Scikit-learn Decision Tree Classifier on an imbalanced dataset. What is a suitable technique to handle this imbalance?
A22: For imbalanced datasets in classification tasks, techniques like applying class weights are suitable. This gives more importance to the underrepresented classes during model training, preventing the model from simply predicting the majority class. Other techniques include stratified sampling.
Q23: What is PyCaret?
A23: PyCaret is a low-code machine learning library that allows you to quickly build and deploy machine learning models.
Q24: What are the two main outputs of the sentiment analysis function in TextBlob?
A24: The two main outputs of TextBlob’s sentiment analysis function are Subjectivity (which indicates if the text is factual or opinion-based) and Polarity (a numerical score indicating the sentiment’s intensity, ranging from -1 for very negative to +1 for very positive).
Q25: In TextBlob, if the polarity score is -0.5, what does that signify?
A25: A polarity score of -0.5 in TextBlob signifies negative sentiment.
Q26: In TextBlob, if the subjectivity score is 0.8, what does that signify?
A26: A subjectivity score of 0.8 in TextBlob signifies that the text is more opinion-based (as opposed to factual).
Q27: Google Data Studio is a tool that allows you to…
A27: Google Data Studio (now Looker Studio) is a tool that allows you to create dashboards for data visualization and reporting.
Q28: Which tag is used to identify an HTML table row?
A28: The <TR> tag is used to identify an HTML table row.
Q29: Which library is used to construct API URLs in Python?
A29: The URLlib library (specifically urllib.parse) is used to construct and manipulate API URLs in Python.
Q30: The final output from the BBC Weather location API is typically in what format?
A30: The final output from the BBC Weather location API is typically in JSON (JavaScript Object Notation) format.
Q31: Which HTML tag is used to make text bold?
A31: The <b> tag (or <strong> for semantic emphasis) is used to make text bold.
Q32: Which Excel chart is most suitable for detecting outliers in data?
A32: The Box and Whisker chart (or Violin plot) is most suitable for detecting outliers in Excel.
Q33: Which feature in Excel enables you to scrape data from websites?
A33: The “Get Data from Website” feature (or “Query” functions) in Excel enables you to scrape data from websites.
Q34: You have a dataset with a ‘sales_date’ column. You want to extract the week number from this column. Which Excel function would you use?
A34: You would use the WEEKNUM function in Excel (e.g., WEEKNUM(date_cell)).
Q35: When computing the correlation coefficient between three variables (e.g., calorie intake, weight, and BMI), do you need to specify input and target variables?
A35: No. For computing correlation coefficients, you do not need to specify input and target variables. The correlation function will compute the pairwise correlation between all specified variables. Input/target specification is primarily for regression models.
Q36: What is the purpose of using the ‘find’ method in Beautiful Soup?
A36: The ‘find’ method in Beautiful Soup is used to locate specific HTML tags or attributes within a web page’s parsed content.
Q37: Which clustering algorithm’s results are sensitive to the initial choice of centroids?
A37: K-Means clustering results are sensitive to the initial choice of centroids.
Q38: Nominatim API can be used to find the type of place.
A38: True. Nominatim can identify the specific type of a place (e.g., a university, a park, a building).
Q39: What does a significant auto-correlation at Lag 1 in a time series imply?
A39: (Instructor marked this for future discussion due to uncertainty.)
Q40: What are the main outputs of the sentiment analysis function in TextBlob?
A40: The sentiment analysis function in TextBlob provides a numerical score (polarity) indicating the sentiment’s intensity. It does not directly classify text as “positive” or “negative” in separate categories; rather, the score itself indicates the sentiment.
Q41: You are using one-hot encoding on a categorical variable in your DataFrame. What happens to your DataFrame after this is done?
A41: After applying one-hot encoding, the DataFrame will have new binary (0/1) columns created for each unique category, and the total number of columns will increase.
Q42: What is the main purpose of using a Pivot Table in Excel?
A42: The main purpose of a Pivot Table in Excel is to summarize data effectively, allowing you to analyze and find connections between different variables.
Q43: What library is used to compute distances between two geographical locations in Python?
A43: The GeoPy library (specifically geopy.distance.distance) is used to compute distances between two geographical locations.
Q44: Which attribute does not belong to a data category while categorizing data based on the specific disclosure risk from which a dataset is to be protected?
A44: (Instructor marked this for future discussion.)
Q45: Which method is used to remove outliers from continuous data?
A45: The Interquartile Range (IQR) method is a common way to remove outliers from continuous data. Outliers are typically identified as values lying outside 1.5 times the IQR from the first or third quartiles.
Q46: What is the purpose of using the ‘find’ method in Beautiful Soup?
A46: The ‘find’ method in Beautiful Soup is used to locate specific HTML tags or attributes within the parsed HTML content.
Q47: Which function from the Scikit-learn library provides precision, recall, accuracy, and F1-score metrics?
A47: The classification_report function from sklearn.metrics provides these performance metrics for classification models.
Q48: Which attribute does not belong to a data category while categorizing data based on specific disclosure risk (repeated)?
A48: (Instructor marked this for future discussion.)
Q49: Which is true about the K-Means clustering algorithm?
A49: K-Means clustering is sensitive to the initial choice of centroids.
Q50: Which API can be used to find the type of place?
A50: The Nominatim API can be used to find the type of place.
Q51: What does a significant auto-correlation at Lag 1 imply in a time series?
A51: (Instructor marked this for future discussion.)
Q52: The sentiment analysis function in TextBlob classifies text as either positive or negative.
A52: False. The TextBlob sentiment analysis function provides a numerical polarity score, but it does not classify text into discrete positive/negative categories itself. You would interpret the numerical score to determine the sentiment.
Q53: What happens to your DataFrame when you apply one-hot encoding to a categorical variable?
A53: When one-hot encoding is applied, new binary (0/1) columns are created for each unique category, and the number of columns in your DataFrame will increase.
Q54: Which Excel chart is a quick way to summarize data?
A54: A Pivot Table in Excel is a quick and powerful way to summarize data.
Q55: What Python library is used to compute the distance between two geographical locations?
A55: The GeoPy library is used to compute the distance between two geographical locations.
Q56: Which library is used to get the week number from a date in Excel?
A56: The WEEKNUM function in Excel is used to get the week number from a date.
Q57: Which attribute does not belong to a data category when categorizing data based on specific disclosure risk (repeated)?
A57: (Instructor marked this for future discussion.)Here’s an FAQ summary of the live tutorial, focusing on student questions and concise answers:
Q1: What’s the main difference in the question paper format we’re discussing today (April 2023) compared to yesterday’s (December 2023)?
A1: Yesterday’s paper had only 21 highly conceptual questions. Today’s paper has 62 questions, which are mostly theoretical. If you know the answer, you know it.
Q2: We have data about country demographics, geographic information, and GDP, and we want to visualize it and generate a summary. Which is the most suitable approach given these options?
A2: The best approach here is to use Power BI for visualization and to generate the data summary. Power BI can perform both of these tasks. (Note: Quill is an extension of Tableau, not Power BI, so using Quill with Power BI for summary would be incorrect.)
Q3: My project requires studying districts and their health indicators. I have a shape file. Which tool should I use?
A3: Since you’re dealing with geographic data and a shape file, QGIS is the most suitable tool. QGIS can create shape files and also allows you to identify districts with high health indicators by assigning colors or creating bar charts based on the data within the shape file.
Q4: What are the two main outputs provided by Excel Azure Machine Learning for sentiment analysis?
A4: The two main outputs of Excel Azure Machine Learning are Sentiment (which indicates if the text is positive, negative, or neutral) and a Score (a numerical value, typically between 0 and 1, representing the intensity of the sentiment).
Q5: I have a dataset with annual cotton production, rainfall, loan interest, and fuel price. I want to compute the correlation between annual cotton production and other variables. What’s the most suitable option?
A5: You can use Excel’s Data Analysis Toolpak, specifically the correlation measure, to compute correlations between variables. Excel’s CORREL function is also suitable. For correlation, you generally don’t need to specify input and target variables as you would for regression; it computes pairwise relationships.
Q6: I’m preparing my dataset and using Pandas Profiling for exploratory analysis. Which of these is a correct statement about its capabilities?
A6: Pandas Profiling provides a surface-level analysis of your data, offering various statistical reports (mean, mode, median, variance, standard deviation). It also provides information about outliers by giving you quartiles (Q1, Q2, Q3) from which outliers can be easily identified.
Q7: ComicGen is a tool for data storytelling. Which of the following is NOT a function of ComicGen?
A7: The statement “You can type your data story and get your comic” is NOT a function of ComicGen. ComicGen is not a generative AI; it allows you to select and customize pre-existing comic characters (emotions, poses) to illustrate your data story, but it doesn’t create comics directly from text input.
Q8: I have a very large matrix with many zero entries. Which function from the SciPy library is useful for efficient storage of such a matrix?
A8: A matrix with many zero entries is called a sparse matrix. For efficient storage in SciPy, you should use the CSR matrix (Compressed Sparse Row) function.
Q9: Which functions and tools are useful for analyzing large graph and network data?
A9: For analyzing large graph and network data, Kumu and SciKit Network are useful tools. Kumu is especially good for visualizing complex networks, while SciKit Network is strong for large-scale graph analysis.
Q10: Which library has functions to extensively extract data from Wikipedia pages?
A10: The Wikipedia library in Python is specifically designed for extracting data from Wikipedia pages. While Beautiful Soup is a general web scraping library, Wikipedia offers a ready-made solution for Wikipedia content.
Q11: I have data about country and population, and I want to visualize it in Tableau, but the map representation isn’t activating. What might be the potential problem?
A11: Tableau can visualize maps using just country names if the data is clean. A potential problem could be column type incompatibility issues. If the country names (even though they are strings) are not recognized as geographic entities by Tableau, the map feature might not activate. Tableau does not require latitude/longitude if a valid country name is provided.
Q12: What tool is helpful to understand the structure of a website or inspect it before writing a web scraping script?
A12: The Inspect Element feature (often called “Developer Tools”) in web browsers is used to understand a website’s underlying HTML structure and inspect its content before writing a scraping script.
Q13: Which library has tools to get a web page’s HTML content into Python?
A13: The Requests library (or urllib) is primarily used to get the raw HTML content of a web page into Python. Beautiful Soup is then used to parse and navigate that HTML content once it’s already in Python.
Q14: Nominatim API can be used to find the type of place.
A14: True. Nominatim can retrieve detailed information about a location, including its specific type (e.g., whether it’s a building, a library, or a university).
Q15: Which Excel chart is most suitable for detecting outliers in data?
A15: The Box and Whisker chart (or Violin plot) is most suitable for detecting outliers in Excel. These charts visually represent data distribution and show values that fall outside the typical range (interquartile range).
Q16: Which Excel feature allows you to scrape data from a website?
A16: Excel has a “Get Data from Website” feature (found under Data > Get Data > From Web) that allows you to import data directly from web pages.
Q17: You have a data column ‘sales_date’ and you want to extract the week number. Which Excel function would you use?
A17: You would use the WEEKNUM function in Excel (e.g., WEEKNUM(date_cell)) to extract the week number from a date.
Q18: When computing the correlation coefficient between three variables (e.g., calorie intake, weight, and BMI), do you need to specify input and target variables?
A18: No. For computing correlation coefficients, you do not need to specify input and target variables. The correlation function will compute the pairwise correlation between all specified variables (often presented as a correlation matrix). This is unlike linear regression where input (independent) and target (dependent) variables are required.
Q19: What is the purpose of using the ‘find’ method in Beautiful Soup?
A19: The ‘find’ method in Beautiful Soup is used to locate specific HTML tags or attributes within the parsed HTML content of a web page.
Q20: K-Means is a clustering algorithm. Which of the following statements about it is true?
A20: K-Means clustering is sensitive to the initial choice of centroids. This means the starting points chosen for the clusters can influence the final clustering result. Methods like N_init (or K-Means++) are used to reduce this sensitivity.
Q21: You are working with a Pandas DataFrame that has a ‘salary_range’ column with categories like ‘medium’, ‘high’, ‘very high’. You want to find the number of employees in each category. Which command can help you?
A21: You can use the value_counts() function on the ‘salary_range’ column (e.g., df['salary_range'].value_counts()) to get a count of occurrences for each unique value in that column.
Q22: You are using the Scikit-learn Decision Tree Classifier on an imbalanced dataset. What is a suitable technique to handle this imbalance?
A22: For imbalanced datasets in classification tasks, applying class weights is a suitable technique. This gives more importance to the underrepresented classes during model training, preventing the model from being biased towards the majority class.
Q23: What is PyCaret?
A23: PyCaret is a low-code machine learning library that simplifies and automates many machine learning tasks, allowing users to build and deploy models more efficiently.
Q24: What are the two main outputs of the sentiment analysis function in TextBlob?
A24: The two main outputs of TextBlob’s sentiment analysis function are Subjectivity (which indicates if the text is factual or opinion-based) and Polarity (a numerical score representing the sentiment’s intensity, ranging from -1 for very negative to +1 for very positive).
Q25: In TextBlob, if the polarity score is -0.5, what does that signify?
A25: A polarity score of -0.5 in TextBlob signifies negative sentiment.
Q26: In TextBlob, if the subjectivity score is 0.8, what does that signify?
A26: A subjectivity score of 0.8 in TextBlob signifies that the text is more opinion-based (closer to 1), rather than purely factual (closer to 0).
Q27: Google Data Studio is a tool that allows you to…
A27: Google Data Studio (now Looker Studio) is a tool that allows you to create dashboards for data visualization and reporting.
Q28: Which tag is used to identify an HTML table row?
A28: The <tr> tag is used to identify an HTML table row.
Q29: Which library is used to construct API URLs in Python?
A29: The URLlib library (specifically urllib.parse) in Python is used to construct and manipulate API URLs.
Q30: The final output from the BBC Weather location API is typically in what format?
A30: The final output from the BBC Weather location API is typically in JSON (JavaScript Object Notation) format.
Q31: Which HTML tag is used to make text bold?
A31: The <b> tag (or <strong> for semantic emphasis) is used to make text bold.
Q32: Which Excel chart is most suitable for detecting outliers in data?
A32: The Box and Whisker chart (or Violin plot) is most suitable for detecting outliers in Excel.
Q33: Which Excel feature enables you to scrape data from websites?
A33: Excel’s “Get Data from Website” feature (or “Query” functions) enables you to scrape data from websites.
Q34: You have a dataset with a ‘sales_date’ column. You want to extract the week number from this column. Which Excel function would you use?
A34: You would use the WEEKNUM function in Excel (e.g., WEEKNUM(date_cell)) to extract the week number from a date.
Q35: When computing the correlation coefficient between three variables (e.g., calorie intake, weight, and BMI), do you need to specify input and target variables?
A35: No. For computing correlation coefficients, you do not need to specify input and target variables. The correlation function computes pairwise correlations between all specified variables.
Q36: What is the purpose of using the ‘find’ method in Beautiful Soup?
A36: The ‘find’ method in Beautiful Soup is used to locate specific HTML tags or attributes within the parsed HTML content.
Q37: Which clustering algorithm’s results are sensitive to the initial choice of centroids?
A37: K-Means clustering results are sensitive to the initial choice of centroids.
Q38: Nominatim API can be used to find the type of place.
A38: True. Nominatim can identify the specific type of a place.
Q39: What does a significant auto-correlation at Lag 1 imply in a time series?
A39: (Instructor marked this for future discussion due to uncertainty.)
Q40: What are the main outputs of the sentiment analysis function in TextBlob?
A40: The sentiment analysis function in TextBlob provides a numerical score (polarity) for sentiment intensity. It doesn’t classify into discrete categories itself.
Q41: What happens to your DataFrame when you apply one-hot encoding to a categorical variable?
A41: When one-hot encoding is applied, new binary (0/1) columns are created for each unique category, and the total number of columns in your DataFrame will increase.
Q42: What is the main purpose of using a Pivot Table in Excel?
A42: The main purpose of a Pivot Table in Excel is to summarize data efficiently, allowing you to analyze and find connections between different variables.
Q43: What Python library is used to compute the distance between two geographical locations?
A43: The GeoPy library (specifically geopy.distance.distance) is used to compute distances between two geographical locations.
Q44: Which attribute does not belong to a data category while categorizing data based on the specific disclosure risk from which a dataset is to be protected?
A44: (Instructor marked this for future discussion.)
Q45: Which method is used to remove outliers from continuous data?
A45: The Interquartile Range (IQR) method is a common statistical method used to identify and remove outliers from continuous data.
Q46: What is the purpose of using the ‘find’ method in Beautiful Soup?
A46: The ‘find’ method in Beautiful Soup is used to locate specific HTML tags or attributes within the parsed HTML content.
Q47: Which function from the Scikit-learn library provides precision, recall, accuracy, and F1-score metrics?
A47: The classification_report function from sklearn.metrics provides these key performance metrics for classification models.
Q48: Which attribute does not belong to a data category while categorizing data based on specific disclosure risk (repeated)?
A48: (Instructor marked this for future discussion.)
Q49: Which is true about the K-Means clustering algorithm?
A49: K-Means clustering is sensitive to the initial choice of centroids.
Q50: Which API can be used to find the type of place?
A50: The Nominatim API can be used to find the type of place.
Q51: What does a significant auto-correlation at Lag 1 imply in a time series?
A51: (Instructor marked this for future discussion.)
Q52: The sentiment analysis function in TextBlob classifies text as either positive or negative.
A52: False. The TextBlob sentiment analysis function provides a numerical polarity score, but it doesn’t classify text into discrete positive/negative categories itself.
Q53: What happens to your DataFrame when you apply one-hot encoding to a categorical variable?
A53: When one-hot encoding is applied, new binary (0/1) columns are created for each unique category, and the total number of columns in your DataFrame will increase.
Q54: Which Excel chart is a quick way to summarize data?
A54: A Pivot Table in Excel is a quick and effective way to summarize data.
Q55: What Python library is used to compute the distance between two geographical locations?
A55: The GeoPy library is used to compute the distance between two geographical locations.
Q56: Which library is used to get the week number from a date in Excel?
A56: The WEEKNUM function in Excel is used to get the week number from a date.
Q57: Which attribute does not belong to a data category when categorizing data based on specific disclosure risk (repeated)?
A57: (Instructor marked this for future discussion.)
Q58: One of the methods for removing outliers in continuous data is the Interquartile Range (IQR).
A58: True. The IQR method is a standard way to identify and remove outliers in continuous data.
Q59: Which tag is used to identify an HTML table row?
A59: The <tr> tag is used to identify an HTML table row.
Q60: What is the purpose of using the ‘find’ method in Beautiful Soup?
A60: The ‘find’ method in Beautiful Soup is used to locate specific HTML tags or attributes within the parsed HTML content.
Q61: What is the primary purpose of using ‘WEEKNUM’ in Excel?
A61: The primary purpose of WEEKNUM in Excel is to extract the week number from a given date.
Q62: Which Excel chart is most suitable for detecting outliers in data?
A62: The Box and Whisker chart (or Violin plot) is most suitable for detecting outliers in Excel.
Q63: Which attribute does not belong to a data category when categorizing data based on specific disclosure risk (repeated)?
A63: (Instructor marked this for future discussion.)
Q64: What is the purpose of using the ‘find’ method in Beautiful Soup?
A64: The ‘find’ method in Beautiful Soup is used to locate specific HTML tags or attributes within the parsed HTML content.
Q65: Which tag is used to identify an HTML table row?
A65: The <tr> tag is used to identify an HTML table row.
Q66: What is the primary purpose of using ‘WEEKNUM’ in Excel?
A66: The primary purpose of WEEKNUM in Excel is to extract the week number from a given date.
Q67: What does a significant auto-correlation at Lag 1 imply in a time series?
A67: (Instructor marked this for future discussion.)
Q68: Which Excel chart is most suitable for detecting outliers in data?
A68: The Box and Whisker chart (or Violin plot) is most suitable for detecting outliers in Excel.
(Note: Questions 39, 44, 48, 51, 57, 63, and 67 were marked by the instructor for future discussion due to uncertainty or being duplicates of previous “to be discussed” items.)