TA session : PYQ April 23 discussion part - 2#
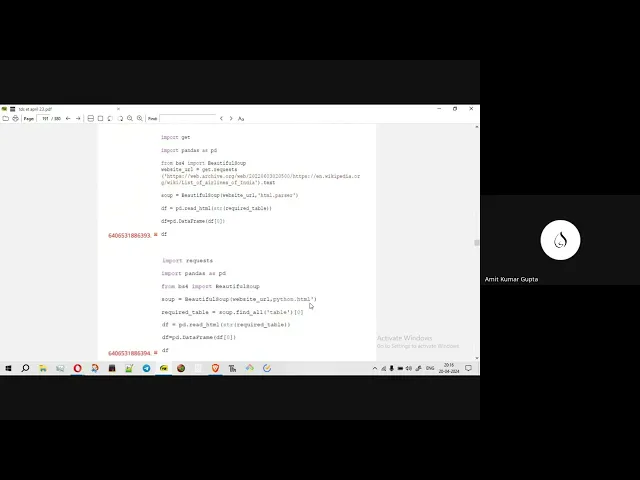
Duration: 2h 9m
Here’s an FAQ based on the live tutorial, structured to address your points:
Q1: What’s the best way to approach learning TDS content?
A1: To approach TDS content effectively, I recommend revising topics, watching lectures, and actively making notes, especially focusing on library names, tools, and their functions. Self-study on your own is also very beneficial.
Q2: When scraping web data for high and low temperatures, how do I differentiate between them if the main class name is the same (e.g., WR_value_temperature)?
A2: If the primary class name is the same for both high and low temperatures, you should look for class names that explicitly state “high value” or “low value” within their full name. For example, use WR_day_temperature_high_value or WR_day_temperature_low_value to correctly identify and separate the data.
Q3: Can I use dot.text to retrieve both Celsius and Fahrenheit temperature values simultaneously?
A3: Yes, using dot.text on the relevant element will allow you to retrieve both Celsius and Fahrenheit temperature values if they are present within that element.
Q4: How do I know which HTML tag (like <div> or <span>) to target during web scraping?
A4: The question or problem statement will usually specify the HTML tag you need to target. For instance, if it tells you to look for <span> tags, you should stick to that, even if <div> tags contain similar information.
Q5: What are common types of errors I should look for when identifying issues in Python code blocks, especially if I’m not fully familiar with the specific task?
A5: When identifying errors, you can use an elimination method by looking for common Python syntax or logic mistakes:
- Undefined Libraries/Modules: Ensure all necessary libraries (like
requests,pandas,BeautifulSoup,NominaTim) are correctly imported and exist. - Incorrect Function Calls: Verify that functions are called with the correct syntax (e.g.,
requests.get()instead ofget.request()). - Undefined Variables: Check that any variable used (like
souporlocator) has been previously defined in the code. - Missing Data Definitions: Make sure all required data (e.g.,
website_url) is defined before it’s referenced in the code. - Output Formatting: Confirm that
printstatements are correctly formatted to display variable values rather than just literal strings (e.g., by using f-strings or.format()).
Q6: What’s a common syntax requirement for both IF and CASE statements in Tableau?
A6: Both IF and CASE statements in Tableau must always end with an END keyword.
Q7: How do IF and CASE statements differ in Tableau?
A7:
IFstatements: Are used for checking conditions (which evaluate to true or false) and use theTHENkeyword for actions. You can useELSEIFfor multiple conditions.CASEstatements: Are used for matching exact values (which can be numerical or string) and use theWHENkeyword (followed byTHEN) for actions.
Q8: Does Tableau use ELIF for multiple conditions, similar to Python?
A8: No, Tableau uses ELSEIF when you need to specify multiple conditions in your logical calculations, not ELIF.
Q9: How do I retrieve latitude and longitude for a specific location using a library like NominaTim in Python?
A9: First, you need to import NominaTim. Then, you create a locator object (e.g., locator = Nominatim(user_agent="your_agent")). After that, you can call locator.geocode("Location Name") to get the location details, which will contain the latitude and longitude. Make sure your print statement is correctly formatted to display the values, not just the string labels.
Q10: What outputs does Azure ML’s sentiment analysis typically provide?
A10: Azure ML’s sentiment analysis usually provides two main outputs: the sentiment (e.g., “positive,” “negative,” “neutral”) and a numerical score indicating the strength of that sentiment.
Q11: When setting up sentiment analysis in Azure ML, how do I specify the input (e.g., movie reviews) and output (e.g., sentiment scores) columns in an Excel sheet?
A11: If your input data, like movie reviews, is in column A starting from row 1 and includes headers, you would specify A1:A11 (or whatever range your data covers) as the input. For the output sentiment scores, you’d specify the starting cell of an empty column, such as C1, which will also include the header.
Q12: How do I create a dropdown menu in Streamlit?
A12: In Streamlit, you create a dropdown menu using the st.selectbox() function. You provide a label (which is the title of your dropdown, like “Hobby”) and a Python list [] containing all the options you want to appear in the dropdown (e.g., ['Dancing', 'Reading', 'Sports']).
Q13: What’s the main difference in purpose between Scikit-learn and Scikit-network?
A13: Both are part of the SciPy ecosystem but serve different primary purposes:
- Scikit-learn: A library for common machine learning algorithms like linear regression, decision trees, K-nearest neighbors (KNN), and K-means clustering.
- Scikit-network: A library specifically designed for analyzing and manipulating large, complex networks and graphs.
Q14: What outputs do TextBlob provide when performing sentiment analysis?
A14: TextBlob typically provides two properties for sentiment: subjectivity (whether the text expresses an opinion or fact) and polarity (how positive or negative the sentiment is).
Q15: What’s the difference between SMOTE and class_weight when dealing with imbalanced datasets in machine learning?
A15: Both techniques help manage imbalanced datasets:
SMOTE(Synthetic Minority Over-sampling Technique): This method creates synthetic (new) samples for the minority class, effectively increasing its representation without simply duplicating existing data.class_weight: This involves assigning different weights to classes during the model’s training process. Minority classes are given higher weights, making the model pay more attention to their correct classification.
Q16: What Excel function is appropriate for analyzing the relationship (specifically the rate of change or trend) between two variables, like lecture hours and exam scores?
A16: For analyzing the relationship between two variables, the SLOPE function is suitable as it calculates the rate of change. You could also use linear regression analysis. The CORRELATION function is generally used when analyzing the relationship between multiple variables.
Q17: What Excel feature helps with running regression analysis?
A17: The Data Analysis Toolpak in Excel provides the necessary tools for performing regression analysis.
Q18: What is Power BI primarily used for?
A18: Power BI is mainly a visualization tool, used to create dashboards and reports from various data sources.
Q19: What type of tool cannot be used for anonymizing data?
A19: Visualization tools like Power BI are not designed for data anonymization. Anonymization techniques are typically implemented using specialized libraries (like Amishia or similar tools in Python) or dedicated data processing methods.
Q20: What is the y-axis in an auto-correlation plot?
A20: The y-axis in an auto-correlation plot represents the correlation coefficient.
Q21: What kind of output does classification_report provide in machine learning?
A21: The classification_report function provides a comprehensive summary of classification metrics, including precision, recall, F1-score, support for each class, and overall accuracy, macro avg, and weighted avg.
Q22: Which Python library is specifically designed for building machine learning models?
A22: PyCaret is a Python library that helps in building and deploying machine learning models with minimal code.
Q23: Which Python library is commonly used for constructing API URLs?
A23: The urllib library in Python is often used for tasks related to URLs, including constructing API URLs.
Q24: What tool can create dashboards for small-scale projects?
A24: Google Studio (now Looker Studio) is a tool that can be used to create dashboards, including for small-scale projects.
Q25: What is class_weight used for in machine learning, and how does it relate to balancing datasets?
A25: class_weight is a parameter used in many machine learning models, particularly for decision trees. It helps to balance imbalanced datasets by assigning different weights to different classes during model training. This ensures that the model pays more attention to minority classes, preventing them from being overshadowed by the majority class.
Q26: What is SMOTE (Synthetic Minority Over-sampling Technique)?
A26: SMOTE is a technique used to handle imbalanced datasets by synthetically creating new samples for the minority class, thereby increasing its representation in the dataset.
Q27: What is TextBlob for, and what are its key output properties in sentiment analysis?
A27: TextBlob is a Python library for processing textual data. In sentiment analysis, its key output properties are subjectivity (the degree to which the text expresses personal opinions or beliefs) and polarity (the sentiment expressed, ranging from -1 for negative to +1 for positive).
Q28: What is Amnesia in the context of data privacy?
A28: Amnesia refers to a technique or tool used for anonymizing data, which means transforming data in a way that protects individual privacy while retaining its utility for analysis.
Q29: How many questions were there in the April 2022 TDS exam?
A29: The April 2022 exam had 62 questions.
Q30: What is the purpose of the classification_report function in machine learning?
A30: The classification_report function is used to display the main classification metrics (precision, recall, F1-score, and support) for each class, along with overall accuracy, macro average, and weighted average. This helps you evaluate the performance of your classification model.
Q31: In Tableau, if the map representation is not activated, what is the likely issue?
A31: The likely issue is a column type incompatibility. When you load data into Tableau, it assigns a data type to each column. For map representation, the column containing location names (like countries) must be specifically identified as a geographical type (e.g., “Country” or “Geographical Role”), not just a generic “string”. If it’s a string, Tableau won’t be able to plot it on a map.
Q32: What is the wikipedia library in Python used for?
A32: The wikipedia library in Python is used to access and parse data directly from Wikipedia, making it easy to retrieve information programmatically.
Q33: What delimiters can be used in the “Text to Columns” function in Excel?
A33: Excel’s “Text to Columns” function is quite flexible and allows various delimiters. You can use common ones like commas, tabs, spaces, semicolons, or even define a custom delimiter. Therefore, all common delimiters can be used.
Q34: What is n_init in K-means clustering, and how does it influence the algorithm?
A34: n_init in K-means clustering specifies the number of times the K-means algorithm will be run with different centroid seeds. Since K-means can converge to different local optima depending on the initial centroids, running it multiple times and choosing the best result (e.g., the one with the lowest inertia) helps in finding a more robust and better clustering solution.
Q35: What properties does the text_blob function return for sentiment analysis in Python?
A35: For sentiment analysis, the text_blob function typically returns subjectivity and polarity scores.
Q36: What does the y-axis represent in an auto-correlation plot?
A36: In an auto-correlation plot, the y-axis represents the correlation coefficient.
Q37: What does the value_counts() method in Pandas do?
A37: The value_counts() method in Pandas is used to count the occurrences of unique values in a Series (a single column of a DataFrame), returning a Series containing the counts of each unique value.
Q38: What properties does TextBlob provide related to sentiment analysis?
A38: TextBlob provides subjectivity and polarity as properties for sentiment analysis.
Q39: What is the purpose of the auto_correlation plot?
A39: The auto_correlation plot is used to visualize the correlation of a time series with its own past values, helping to identify patterns and dependencies within the data over time.
Q40: What Excel function is used for calculating the slope in a two-variable analysis?
A40: The SLOPE function in Excel is used to calculate the slope of the linear regression line between two sets of data points.
Q41: What properties does TextBlob provide for sentiment analysis?
A41: TextBlob provides subjectivity and polarity as its key properties for sentiment analysis.
Q42: What are the two main outputs provided by Azure ML for sentiment analysis?
A42: The two main outputs are sentiment (e.g., positive, negative) and a numerical score.
Q43: What does the y-axis in an auto-correlation plot represent?
A43: The y-axis represents the correlation coefficient.
Q44: What tool is used to create dashboards for small-scale projects?
A44: Google Studio (now Looker Studio) is a tool for creating dashboards, suitable for small-scale projects.
Q45: What tab in the developer tools is used to identify API calls?
A45: The Network tab in the developer tools (e.g., Chrome Developer Tools) is used to monitor and identify API calls made by a web page.
Q46: What tool helps in building machine learning models?
A46: PyCaret is a Python library that helps in building and deploying machine learning models.
Q47: What outputs does classification_report provide?
A47: classification_report provides precision, recall, F1-score, support for each class, and accuracy, macro avg, weighted avg overall.
Q48: What is class_weight used for in decision tree classifiers?
A48: class_weight is a parameter used to assign higher weights to minority classes in the dataset. This helps to address imbalanced datasets during the training of models like Decision Tree Classifiers.
Q49: What is SMOTE (Synthetic Minority Over-sampling Technique)?
A49: SMOTE is a technique used to balance imbalanced datasets by generating synthetic samples for the minority class, rather than simply duplicating existing ones.
Q50: What properties does TextBlob provide related to sentiment analysis?
A50: TextBlob provides subjectivity and polarity as its key properties for sentiment analysis.
Q51: What is the y-axis in an auto-correlation plot?
A51: The y-axis represents the correlation coefficient.
Q52: What is Google Studio (now Looker Studio) used for?
A52: Google Studio is used for creating dashboards.
Q53: What outputs does classification_report provide?
A53: classification_report provides precision, recall, F1-score, support, accuracy, macro avg, and weighted avg.
Q54: What tool is used to identify API calls in a web page?
A54: The Network tab in the developer tools of your browser is used to identify API calls.
Q55: What Python library is used for creating maps?
A55: folium is a Python library used for creating interactive maps.
Q56: What tool is used for building machine learning models?
A56: PyCaret is a Python library used for building and deploying machine learning models.
Q57: What outputs does classification_report provide?
A57: classification_report provides precision, recall, F1-score, support, accuracy, macro avg, and weighted avg.
Q58: What is class_weight for in decision tree classifiers?
A58: class_weight is a parameter to assign higher weights to minority classes to address imbalanced datasets during training.
Q59: What is SMOTE?
A59: SMOTE is a technique to generate synthetic samples for the minority class in imbalanced datasets.
Q60: What properties does TextBlob provide for sentiment analysis?
A60: TextBlob provides subjectivity and polarity properties.
Q61: What is Amnesia in the context of data?
A61: Amnesia is a technique for anonymizing data to protect privacy.
Q62: What is the y-axis in an auto-correlation plot?
A62: The y-axis represents the correlation coefficient.