TA’s Session TDS 2024 12 05 19 52 GMT+05 30 Recording#
Duration: 3h 0m
Here’s an FAQ based on the live tutorial:
Q1: Jivraj, can you give an update on GSA6 or internet access?
A1: I’m having trouble accessing the internet on my laptop. Regarding GSA6, I haven’t received an email, so I’m not sure if it’s updated or what the last information was. I can check if it’s updated.
Q2: Could you message Narayan to ensure the changes for GSA6 are pushed, and is our end of the work done?
A2: Yes, I’ll do that right away. On our end, everything is done.
Q3: Jivraj, can you demo the UV part later?
A3: Yes, whenever you’re ready, just let us know, and we can demonstrate the UV part. It will be the last step of the workflow.
Q4: What is Project 2 about, and what makes it unique?
A4: Project 2 involves writing an LLM-based application that analyzes a dataset. It’s designed to be innovative, something most people, even experienced coders, haven’t done before. We’re truly blown away by what the available tools allow us to achieve with it.
Q5: What does “convince the LLM that your code and output are good” mean?
A5: For Project 2, the LLM will be evaluating your submissions instead of a human. So, “convince the LLM” means you need to structure your code and its output in a way that our evaluating LLM perceives it as correct and high-quality according to the scoring rubric.
Q6: Any advice for starting the project, and is it a fun project?
A6: My main advice is to start early, as a lot of effort went into creating the workflow for you. Despite the complexity, it’s a very fun project – in fact, I’d say it’s the most fun project I’ve done in a long time!
Q7: Can you describe the core workflow, including the main Python file and its output?
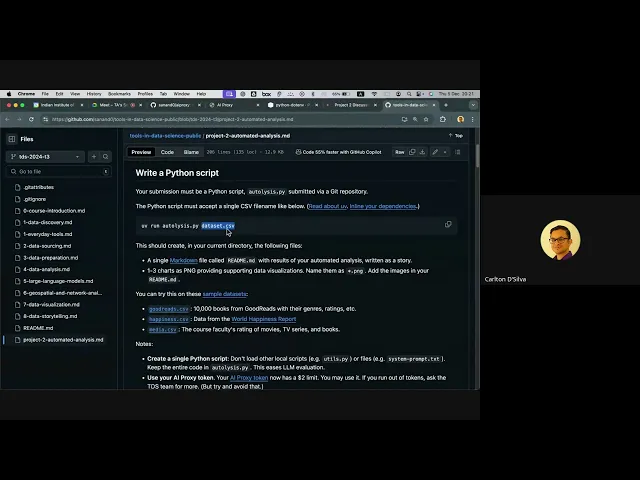
A7: You’ll create a single Python file named autolysis.py (ensure the name is exact). This script will take a CSV file as a command-line argument. Its main output will be a single readme.md file containing automated analysis of the dataset, presented as a story. It should also produce 1-3 charts in PNG format. The entire process should be fully automated, with no human prompts required during execution.
Q8: What kind of data sets will autolysis.py work with, and how should it handle them?
A8: Your script must work with any valid CSV file in a tabular format; you cannot make assumptions about its specific content or structure. We’ll provide example CSVs, but we’ll use a different one during the demo to show its generality. Your code must be robust enough to handle various datasets.
Q9: What should the readme.md file contain?
A9: The readme.md file should present the automated analysis as a narrative or “story.” For example, if analyzing a book dataset, it might discuss genre preferences or correlations between different types of books. The goal is to extract meaningful insights from the data and present them clearly.
Q10: Should the project also produce charts, and what are the constraints?
A10: Yes, your script should produce 1-3 charts that support the story in your readme.md. These charts must be in PNG format. Be mindful of token limits; less is often more. Aim for meaningful, insightful charts rather than simplistic ones. Also, while Seaborn is suggested in the documentation, our testing shows LLMs aren’t great with it, so feel free to use other charting libraries.
Q11: Does the project require a single Python file, or can I use multiple scripts?
A11: For final submission, everything must be contained within a single autolysis.py file. During development, however, you can work on different functional blocks in a Jupyter notebook and then integrate them into that single file.
Q12: How should I handle the API token, especially for security?
A12: Do not commit your API token directly into your repository, as it’s highly susceptible to theft by bots. Instead, your code should fetch the AI_PROXY_TOKEN from the environment using os.getenv. We will provide this token in the environment when we run your script. For local development, you can use a .env file and python-dotenv to load it, adding .env to your .gitignore.
Q13: Why is sending the entire dataset or analysis to the LLM problematic, particularly when using API calls?
A13: LLM API calls don’t retain context like a continuous chat interface does. Each call is treated as a new conversation. To maintain context, you’d have to resend previous conversation history with each new message, quickly exceeding token limits. LLMs are also not great at complex math. Therefore, send only small, summarized snippets of data to the LLM to get suggestions or infer properties. Your Python code then performs the full analysis on the complete dataset. I will demonstrate techniques to manage this token usage effectively.
Q14: What is uv run and how do I handle dependencies for the project?
A14: uv run is a command we’ll use to execute your script. It automatically creates a virtual environment, installs declared dependencies, and runs your autolysis.py. You specify dependencies by adding a dependencies = ["pandas", "requests"] list (or similar) at the top of your autolysis.py file. This ensures consistent execution environments.
Q15: How will the project be evaluated, and what’s the deal with the 12-mark bonus?
A15: The project is scored out of 20 marks. There’s a 12-mark bonus available: 8 marks for code uniqueness (to prevent copying, we’ll use LLMs to detect similarity) and 4 marks for providing interesting analysis. This bonus incentivizes originality and provides an opportunity to earn full marks even if you don’t perfectly fulfill every requirement.
Q16: How do I get the LLM to understand my CSV data, especially column types, if I can’t even see the file?
A16: You’ll send a sample (e.g., first 10 rows) of the CSV data to the LLM. Then, using function calls, you’ll ask the LLM to provide structured output containing column names and their inferred data types (numerical, string, boolean, datetime). This structured output allows your Python code to programmatically act on the LLM’s understanding of the data. For example, if there’s “1B” in an “age” column, LLM might infer it’s numeric, then your code can handle the non-numeric part.
Q17: What if the LLM misidentifies a column type (e.g., ‘1B’ in an ‘age’ column as numeric)?
A17: Your Python program’s role is to handle these nuances. Once the LLM suggests a type (e.g., numeric for ‘age’), your code can then run an apply function (or similar) over the full column to clean the data. It can convert non-numeric entries (like ‘1B’) to NaNs, ignore them, or convert the entire column to a string if too many non-numeric values are present. The LLM’s suggestion guides your code’s more robust handling of the actual data.
Q18: What kinds of numerical analysis can I perform, and how can the LLM help with binning?
A18: Once column types are identified, your Python code can perform standard numerical analyses like making NaNs, ignoring rows with bad data, interpolating missing values, or calculating summary statistics (mean, median, etc.). For binning, you can ask the LLM to determine if a numerical column is “binable” (e.g., based on the number of unique values, range), and then suggest an appropriate number of bins. This provides structured insights for subsequent charting.
Q19: How can I analyze string or categorical columns effectively?
A19: For string/categorical columns, the LLM can identify if they are “binable” (e.g., if there are a reasonable number of unique categories). It can also suggest appropriate analyses, such as frequency counts, identifying common patterns, or even recommending which other columns to correlate with. The key is to receive structured output from the LLM that your Python code can then process for detailed analysis.
Q20: How can the LLM actually write code for me, and what if that code has errors?
A20: The LLM can generate Python code for specific tasks (like creating a chart). You’ll specify the desired chart type (e.g., “choose a chart for this data”) in a function call. The LLM returns the code as a string. Your program uses json.loads to parse this string into a Python object, then exec() to run the code. If errors occur, your program catches them, sends the error message back to the LLM, and asks it to debug and provide corrected code. This iterative error-correction loop continues until valid code is generated and executed successfully.
Q21: What is the final output of the project, and can you summarize the overall workflow?
A21: The final output is a PNG chart and a readme.md file telling the story of your analysis. The overall workflow involves: 1) Getting column types from LLM, 2) Identifying analyzable/binable columns, 3) Choosing specific analysis types, 4) Asking LLM for Python code, 5) Executing the code (with error-correction loops), and 6) Generating the final chart and readme.md.
Q22: Is the session clear, and are there any final questions?
A22: Yes, it gives somewhat clarity. We’ll have to try it for ourselves.
Q23: How many students are enrolled in TDS this term, and how do they fare with project work?
A23: Technically, there are 1389 students enrolled. Unfortunately, many tend to copy/paste, which is a shame because they miss out on learning these fantastic, cutting-edge skills. When students genuinely engage, it’s incredibly rewarding.
Q24: What’s the best part about this project experience?
A24: The best part is seeing the “self-writing code” in action. It’s truly mind-blowing to witness a program that writes itself, debugs itself, and produces useful output like a PNG chart without direct human coding. This project is very different, very flexible, and significantly enhances general thinking and problem-solving abilities.