Project 2 TA’s Session TDS 2024 12 05 19 52#
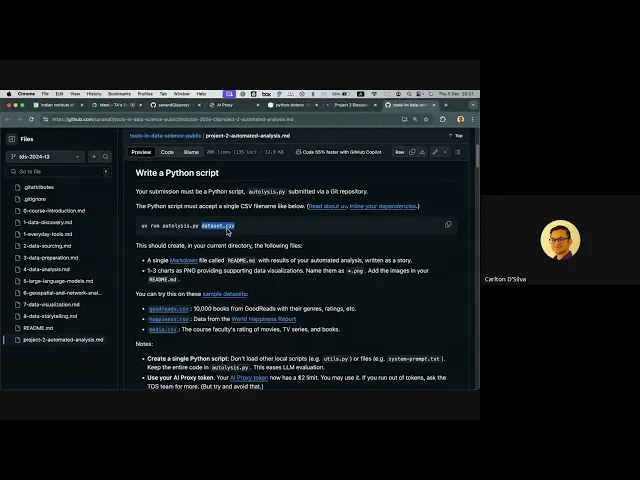
Duration: 3h 0m
Here’s an FAQ based on the live tutorial:
Q1: What is Project 2 about?
A1: Project 2 is about developing an innovative LLM-based application that can analyze a given dataset and convince another LLM of the quality of your code and its output.
Q2: What does “convincing the LLM” mean?
A2: It means your code needs to produce results that satisfy the evaluation criteria of our LLM (the instructors’). We’ll use an LLM to evaluate your project submissions, replacing human reviewers to ensure fairness and efficiency. So, the LLM you’re trying to “convince” is indeed the same LLM we’ll use for evaluation.
Q3: What’s the main advice for starting Project 2?
A3: Start early. This is an innovative and fun project, but it requires significant effort to develop the workflow. Don’t underestimate the time needed.
Q4: What is the exact filename for the main Python script?
A4: Your main Python script must be named autolysis.py. Please do not deviate from this specific filename or any other specified instructions, as strict adherence to these guidelines is crucial for successful evaluation.
Q5: How do I run my autolysis.py script and manage its dependencies?
A5: You’ll use a uv run command to execute your script. This process involves adding a special code block to your script and ensuring uv is installed in your environment. uv automates dependency management by creating a virtual environment and installing necessary libraries, which ensures your script runs consistently across different machines. We will use uv for evaluation.
Q6: Where do I get my API token, and what’s the limit?
A6: You can obtain your API token from the link we’ve provided, and the limit has been increased to $2. With careful coding practices, you should use much less than this (for example, our demo used only 8 cents). If you anticipate exceeding the token limit during development, please inform us. We’ll also show you techniques in the session to avoid hitting the limit through efficient API calls.
Q7: Should I commit my API token to my Git repository?
A7: No, absolutely not. Public repositories are frequently scraped by bots, and any sensitive information like API tokens will almost certainly be stolen. Always store your API token in a local .env file and add .env to your .gitignore to prevent it from being pushed to the repository.
Q8: My project needs to be a single Python file, but how do I develop and test it effectively?
A8: You should develop your code in modular pieces, perhaps in a Jupyter Notebook, to test functionalities independently. Once individual components are working correctly, you can then combine them into the single autolysis.py file required for your final submission.
Q9: What kind of dataset will my script receive?
A9: Your script will receive any valid CSV file in a tabular format. The sample CSVs we provide are merely examples; your code must be robust enough to handle various datasets.
Q10: What should my script output?
A10: Your script should produce two main outputs: 1. A single markdown file named readme.md containing an automated, story-like analysis of the dataset. 2. 1-3 PNG chart files that visually support your analysis.
Q11: Why is there a limit of 1-3 charts, and must they be PNGs?
A11: The limit of 1-3 charts is to manage token usage. LLMs consume tokens for processing your code, image data, and the evaluation script. Fewer, more meaningful charts are preferred. All charts must be in PNG format.
Q12: How can I create interesting analysis without knowing the CSV file beforehand?
A12: This is a core challenge of the project, and we will demonstrate techniques for creating intelligent code that can adapt to and analyze diverse datasets effectively.
Q13: What’s the difference between interacting with GPT via its web UI and using its API for context?
A13: The GPT web UI maintains a “context window,” remembering previous turns in a conversation. However, API calls are stateless; each call is treated as a new, independent conversation. To maintain context when using the API, you must explicitly include relevant previous conversation history along with your new query.
Q14: What’s the implication of stateless API calls for token usage, and should I send the entire dataset to the LLM?
A14: Manually including context in API calls increases the amount of information sent, thus consuming more tokens. Therefore, you should not send the entire dataset to the LLM. Instead, send a summary or a small sample (e.g., 5-10 rows). The LLM can then suggest analysis based on this sample, and your code will perform the full analysis on the complete dataset. You must balance sending “enough” information with not sending “too much” to stay within token limits.
Q15: Is there a specific LLM available for TDS students?
A15: Yes, there’s a Virtual GPT TA specifically trained on TDS modules and videos. You can find a link to access it in a discourse post titled “Dawn of the virtual TA.”
Q16: How is the project graded, and what’s the 12-point bonus about?
A16: The project is scored out of a total of 20 points. There’s a significant 12-point bonus: 8 points for uniqueness (our LLM will check for code embedding similarity to prevent plagiarism) and 4 points for the interestingness of your analysis. The total score is capped at 20, so a strong bonus can help compensate for minor issues in other areas.
Q17: What is the purpose of LLM function calling?
A17: LLM function calling is used to receive structured data back from the LLM, rather than free-form text. This is critical because your Python code needs structured output (e.g., JSON) to effectively process and act upon the analysis results. LLMs are excellent at understanding and generating human-like text, but your program needs machine-readable data.
Q18: How do I implement function calling in my code?
A18: 1. Define a function: In your Python code, you’ll define a function that describes the desired structured output using a JSON schema. This schema specifies the function name, a clear description of its purpose (to help the LLM decide when to use it), and the parameters (with their respective data types) you expect to receive. 2. Prompt for code: The LLM will then return a structured JSON object that conforms to your function’s schema, containing the requested information. 3. Process output: Your program executes the LLM’s generated code. If errors occur, your program catches them, feeds the error messages back to the LLM, and asks it to correct the code iteratively until a working solution is achieved.
Q19: Can the LLM identify column types and handle unclean data without seeing the full dataset?
A19: Yes. By sending a sample of the data (e.g., 10 rows) and a clear prompt, the LLM can infer column types (numeric, string, boolean, datetime). It’s intelligent enough to distinguish between truly numeric columns (even with minor unclean entries like “1B”) and non-numeric ones, which is a significant advantage over simple programmatic type checking.
Q20: What are the subsequent analysis steps once column types are identified?
A20: Once column types are identified, your Python code can perform various actions: _ Data Cleaning: Handle unclean data (e.g., convert problematic entries or interpolate missing values). _ Summary Statistics: Calculate averages, correlations, etc. _ Outlier Detection: Identify and manage outliers. _ Binning: Create bins for numerical data. * Charts: Generate visualizations based on the data.
Q21: What are “non-binnable” numerical columns, and can the LLM identify them?
Q21: Non-binnable numerical columns are those like Aadhar numbers, phone numbers, or social security numbers, where the numerical value itself has no inherent order or magnitude for binning purposes. Your Python program cannot intelligently identify these, but the LLM can. The LLM can distinguish between truly binnable numeric data and identification numbers, enabling a more nuanced approach to data processing.
Q22: How does the LLM generate charts, and do I need to write code for them?
A22: The LLM can dynamically generate code for charts. You send a prompt asking the LLM to choose an appropriate chart type (e.g., based on the column types) and write the Python code for it. Your program then executes this code, which can generate a PNG output. The LLM handles the specifics of chart selection, axis labeling, and data representation, minimizing your manual coding effort.
Q23: What’s the main takeaway for my Project 2, and what are the benefits of this approach?
A23: The main takeaway is to embrace the iterative and flexible nature of LLM development. Start with simple prompts and gain confidence, then add complexity. This approach allows for dynamic analysis and visualization, as the LLM can intelligently choose chart types, write code, and output results without constant manual intervention. It’s a powerful “program that writes itself.”
Q24: What if the LLM-generated code has errors?
A24: Your program is designed to catch execution errors from LLM-generated code. When an error occurs, your program feeds the error message back to the LLM (along with the original request and code), asking it to correct itself. This iterative feedback loop helps the LLM auto-correct and refine its code until a working solution is achieved.
Q25: Can I restrict the LLM to use only certain libraries when generating code?
A25: Yes. You can specify a list of allowed libraries in your code’s initial setup. When you prompt the LLM to generate code, you can instruct it to use only these pre-approved libraries. This ensures consistency and prevents dependency issues.
Q26: What’s the typical workflow for Project 2?
A26: 1. Identify Data Types: Prompt the LLM with a sample of your CSV data to identify column names and their inferred data types (e.g., numeric, string, categorical, binnable). 2. Suggest Analysis: Based on these identified data types, ask the LLM to suggest appropriate statistical analyses (e.g., correlations, outlier detection, binning). 3. Generate Code: Request the LLM to write Python code for a specific analysis (e.g., generate a chart, perform a cleanup). 4. Execute & Debug: Run the LLM-generated code. If errors occur, send the error message back to the LLM for correction. 5. Output Results: The final working code will produce the required readme.md and PNG charts.
This iterative process ensures the LLM generates accurate and functional code for your project.